Using the MEGA65 Monitor to troubleshoot assembly programs
When we last attempted an assembly language program for the MEGA65, I described debugging techniques that involve inventing ways to visualize the memory and behavior of your program, often requiring adding code to the program temporarily to do so. Today I want to explore a feature of the MEGA65 that can help with this, the MEGA65 machine language monitor, using our Game of Life program as an example.
Articles in this series:
- Game of Life on the MEGA65, in BASIC
- Game of Life on the MEGA65, in assembly language
- Using the MEGA65 Monitor to troubleshoot assembly programs
- Using MEGA65’s Matrix Mode
Review: GoL, memory, and symbols
We will use the Game of Life assembly language program for our exploration. It uses a single assembly language file written for the ACME assembler. You can get the Game of Life source file here:
To assemble it on your PC, run the acme command with the golml.a filename as an argument:
acme golml.a
This produces the file golml.prg, which you can run on your MEGA65.
The assembler converts the assembly language statements into machine code. This machine code is loaded into a contiguous region of the MEGA65’s memory that we specify in the assembly source file. We told the assembler to assemble starting at address $2001, which is where the MEGA65 keeps BASIC programs. Our machine code includes bytes that represent a BASIC program that invokes our machine code, so it’s easy for a user to run our program with the RUN command.
Most programs have a main loop that repeats a process continuously, such as waiting for user input or updating the display. For GoL, we did something a little unusual by implementing the main loop in the BASIC part of the program. A more typical assembly language program would implement the main loop in assembly language and use a simpler BASIC header to start it. Our weird technique has advantages and disadvantages for debugging, but for today we should be able to ignore the difference.
Our assembly code defines symbols that identify the memory addresses where important code and data regions begin. In our program, swapbuf represents the address of the first instruction of a subroutine. row_ct is the address of a one-byte variable. The MEGA65 never sees the symbol name: the generated machine code uses the numeric address calculated by the assembler, not the symbol name, to refer to those memory locations.
It is sometimes useful to know what addresses the assembler determined for those symbols, so we can locate and inspect those memory locations ourselves on the MEGA65 for troubleshooting purposes. The ACME assembler can produce a file listing the addresses for every symbol. To do so, provide the --symbollist argument with a name for the symbol list file:
acme --symbollist golml.lst golml.a
If you’d like to follow along, make sure you have built the GoL program into a .prg file, and have a way to transfer it to your MEGA65, either via a JTAG or serial connection, or by copying it to the SD card and loading it with this command: DLOAD "GOLML.PRG",U12
The three monitors
A machine language monitor, or just monitor, is a program for inspecting and experimenting with the internal state of a computer’s CPU and memory. Monitor programs often have cryptic user interfaces with inscrutable commands (H2001 2100 22) and symbolic displays. This is because they are traditionally intended to fit into small amounts of memory, coexisting with your own program in memory so you can use the monitor to troubleshoot the program.
Several vintage microcomputers had a monitor program built into their operating system ROM, including the Apple II, the Commodore 128, and the unreleased Commodore 65 on which the MEGA65 is based. Notably, the Commodore 64 did not include a built-in monitor. C64 programmers had to type in monitor programs from books and magazines, or add them to memory with utility cartridges. I’m personally disappointed with this omission because I feel like I would have understood much more about computers as a kid if I had a monitor to play with, and I didn’t understand their significance well enough to type one in from a book.
As if to mollify my childhood disappointment, the MEGA65 has not one but three built-in monitor programs:
- A monitor based on the C65 monitor that runs like a regular program
- A monitor built into the Freeze menu
- A monitor capable of running alongside an active program
I’m going to call these the MEGA65 monitor, the Freeze monitor, and (for reasons that will become apparent in a later article) the Matrix Mode debugger.
For this article, we’re going to use the MEGA65 monitor. It is handy, powerful, and easy to use. We’ll look at the Matrix Mode monitor in a subsequent article, which is even more powerful but a bit more advanced.
We’ll look at the Freeze monitor briefly at the end of this article. It only has a few features.
See Appendix K of the MEGA65 Book (the big one) for a reference of the monitor commands. This also has a command reference for the Matrix Mode debugger.
The MEGA65 monitor
The MEGA65 monitor starts when you type the MONITOR command at the BASIC READY. prompt. It also kicks in when your program issues a brk instruction. (You can also jump right into it by holding Stop during boot, but this isn’t particularly useful.)
We looked at this a little bit in the previous article, but just to review, make sure the golml.prg is loaded into memory, then enter the MONITOR command:
MONITOR
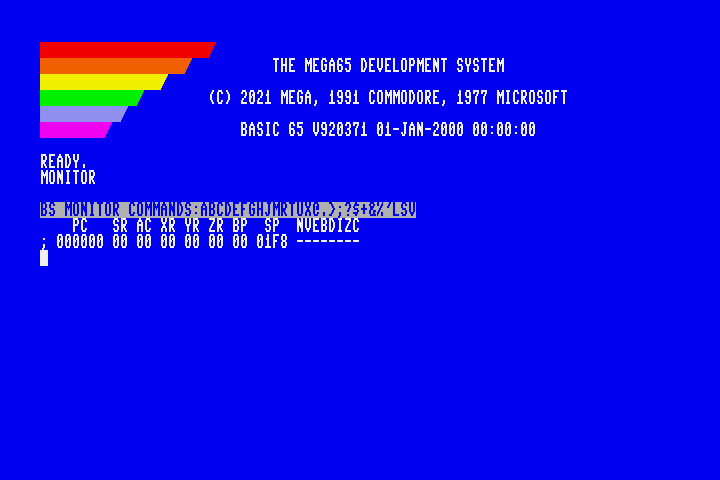
When the monitor starts, it prints a header line and the current status of the CPU registers. You type monitor commands at the blinking cursor, and the monitor responds with results.
The header line lists all of the one-character command names available. For a reminder of what each character means, type the ? command then press Return.
?
To exit back to BASIC, type the X command then press Return.
X
The monitor’s command editor works just like the BASIC screen editor. You can cursor up to previous lines, edit them, and press Return to execute them. You can also press Shift+Clr/Home to clear the screen, or Esc then @ to clear just from the cursor to the bottom of the screen. (Even that undo Home feature I added works here.)
Hexadecimal, decimal, binary, and PETSCII (and octal)
In the monitor, all unadorned values are in hexadecimal, even though they don’t appear with a $. This is also true for arguments you type for commands, such as M 08A0. The $ is optional for hexadecimal arguments; it’s also supported.
If you need to enter a decimal number, precede it with +, such as +255. You can also enter a binary number with %, such as %00110010. The monitor also supports octal (base 8) with a &.
You can enter a PETSCII character as a byte value by preceded by a ' (Shift+7 on the MEGA keyboard), such as 'A. This works anywhere a byte value is accepted. Only typeable PETSCII characters can be entered this way. There is no “quote mode” as in BASIC to access PETSCII control codes. Just enter such values as hexadecimal numbers; refer to a PETSCII reference chart.
Need a quick way to convert a number between all of these formats? Just enter the number without a command, and the monitor will display all of the conversions. The $ prefix is required when entering a hexadecimal value to avoid confusing it with other commands. When you type $5A, it prints:
$5A
+90
&132
%1011010
'Z
Inspecting registers
The monitor displays the values of the CPU registers as its first action. To display these again later in the session, use the R command.
R
This displays something like this:
BS MONITOR COMMANDS:ABCDEFGHJMRTUX@.>;?$+&%'LSV
    PC   SR AC XR YR ZR BP  SP  NVEBDIZC
; 00FFA2 00 00 00 00 00 00 01F8 --------
PC is the Program Counter, the address of the next machine code instruction the CPU intended to execute before starting the monitor. This is 00FFA2 when starting the monitor with the MONITOR command, or the address after the brk instruction if that’s what triggered the monitor.
SR is the Status Register, a representation of all of the CPU flags as an eight-bit value (in hexadecimal). These flags are also visualized on the far right (NVEBDIZC), from most significant bit to least: Negative, oVerflow, stack Extend, Break, Decimal, Interrupt disable, Zero, and Carry. We encountered the carry bit in our discussion of addition and subtraction, and we used the zero bit with our countdown loops and branch instructions. If the monitor is triggered by brk, the break flag appears here as set.
AC is our good friend the Accumulator, holding an eight-bit value for our math and storage operations. XR, YR, ZR are the X, Y, and Z registers. We used the X and Y registers in our GoL program as well; the Z register is just as capable. (The 6502 did not have a Z register. It was introduced with the 65CE02, on which the MEGA65’s 45GS02 is based.)
BP is the base page, aka the B register. We discussed base page addressing in the previous article.
SP is the Stack Pointer. We haven’t discussed the stack yet, but we’ve used it! When a program uses jsr to jump to a subroutine, the CPU pushes the address after the jsr instruction to the stack. When the subroutine ends with a rts instruction, the CPU returns control to the calling location by pulling the address off of the stack and assigning it to the program counter. The CPU has multiple uses for the stack, and programs can use it themselves. The stack pointer register remembers the address of the topmost item on the stack.
There’s a lot more to say about how these features of the CPU work. Hopefully this is enough to explain the register display for now.
The ; command changes the value of the registers. The format of the arguments is identical to the output of the R command. The easiest way to use this is to print the current register values with R, cursor up to the line, change the value you want to update, then press Return.
; 000000 00 FF 00 00 00 00 01FB --------
It would be inaccurate to say that the monitor reports the “current” state of the CPU’s registers. The monitor itself is a running program, so while it is running the program counter is actually jumping all over the monitor code, and the registers are changing to support the monitor’s own algorithms. The monitor assumes you are more interested in the state of the CPU as it was just after running your code. It takes advantage of how CPU interrupts work to figure this out.
Inspecting memory
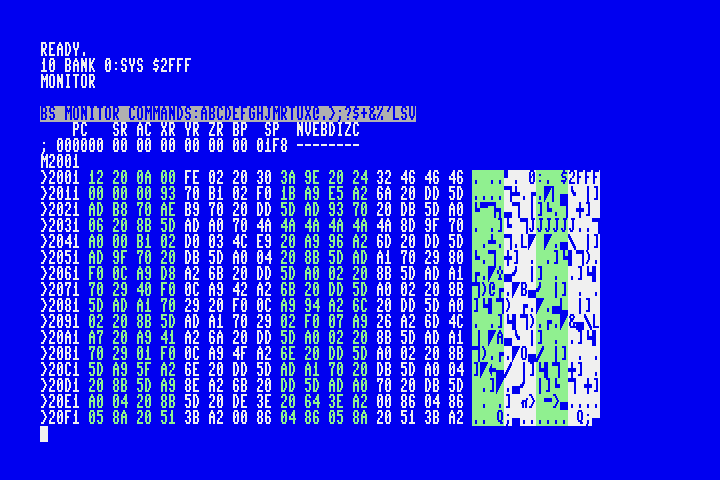
One of the primary uses of the monitor is to display the contents of memory. We saw this when we were examining how the MEGA65 encodes BASIC programs. Let’s take another look.
The M command accepts a starting address and an optional ending address, and displays the contents of that memory region as both hexadecimal values and as PETSCII characters.
M 2001

M 2001 2031
You can type M without arguments to display the next few rows after the previous M command.
M
Each line shows 16 consecutive memory locations, with the address of the first location at the beginning of the line. For example, the address of the value $22 in the first line of the GoL BASIC header is $2006, and shown on this line by the command M 2001:
>2001 3D 20 0A 00 85 22 05 93 44 52 41 57 20 41 20 50 = ..."..DRAW A P
Our GoL program set aside some program memory for the line buffer. According to the symbol list file golml.lst, the line buffer starts at address $21ed. We can see that region in the monitor:
M 21ED
>21ED 00 00 00 00 00 00 00 00 00 00 00 00 00 00 00 00 ................
>21FD 00 00 00 00 00 00 00 00 00 00 00 00 00 00 00 00 ................
>220D 00 00 00 00 00 00 00 00 00 00 00 00 00 00 00 00 ................
>221D 00 00 00 00 00 00 00 00 00 00 00 00 00 00 00 00 ................
...
The buffer starts as 160 zeroes because we told the assembler to insert 160 zeroes into the machine code at that location (!fill 160,0). When we loaded the program, those zeroes were written to memory.
The monitor command for setting new values in memory is > followed by a starting address and one or more byte values:
>21ED 01 02 03 04
For convenience, this is how the M command prints its results. You can cursor up to any line of M output, edit a value in place, then press Return to set the new values.
Starting the monitor from within the program
Our program updates the line buffer memory as it runs its update algorithm. It would be useful if we could examine it at specific points in the algorithm to make sure it is working.
If we modify our program to exit and return to BASIC in the middle of the algorithm, the machine code that runs BASIC might overwrite some of the state we care about—especially the registers—before we get a chance to run the MONITOR command. In the case of our GoL program and our BASIC outer loop, exiting from the assembly routine doesn’t even quit the program: it just starts the next loop. In general, it is difficult to fully exit a program from within a subroutine, requiring the entire stack of callers to have code to hasten the exit.
This is what the brk instruction is for. When the CPU encounters a brk, it invokes an interrupt, a special mode of the CPU that knows how to stop what the current program is doing to do something else. The CPU pushes the program counter, registers, and status flags onto the stack, temporarily disables further interrupts, then looks up the address stored at a special memory location known as the IRQ vector. It assigns the IRQ vector to the program counter, causing the CPU to execute the machine code at that address. The brk instruction also sets the break status flag on the stashed flag value to distinguish a break interrupt from other kinds of IRQ interrupts. The MEGA65 ROM sets up the IRQ vector to start the monitor if the break flag is set.
Let’s set up an experiment to view the line buffer in the monitor during GoL execution when it has non-zero contents. We will add code to brk when the GoL routine has completed processing the 4th row, i.e. when row_ct is 19 ($13). (Remember that row_ct is a countdown from 23, so it’ll be 19 at the beginning of the 5th row.)
Put this under the next_col label:
next_col
    lda row_ct
    cmp #19
    bne +
    brk
+
Build, transfer, and run this program. Be sure to regenerate the symbol list with --symbollist golml.lst, as it will have changed because we added code. At the GoL draw prompt, draw a pattern that puts alive cells on lines 3 and 4, something like this:
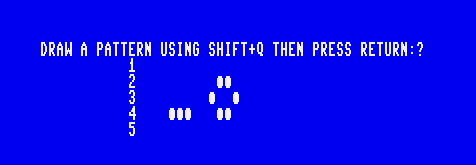
Press Return to start the GoL main loop. The monitor activates after the program processes the first four rows.
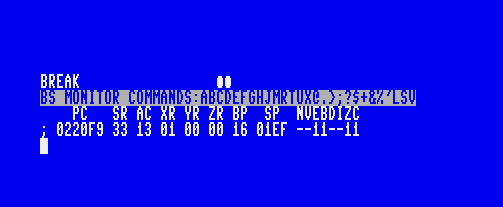
The program counter PC reads 0220F9. Ignoring the 02 part of the address for a moment, we recognize this as a location just after our next_col symbol, which our updated symbol list says is $20f1.
The accumulator AC is 13 because we just used it to test whether row_ct is equal to 19 decimal ($13 hexadecimal). The X, Y, and Z registers are whatever values they contained from previous calculations. The base page BP is 16 (hexadecimal) because that’s how we set it at the beginning of the program. We can explain the break and zero flags being set from the code we just added: zero is set because that’s how cmp reports equality, and break is set by brk.
We can now examine the line buffer contents at its new address, $21F5:
M 21F5
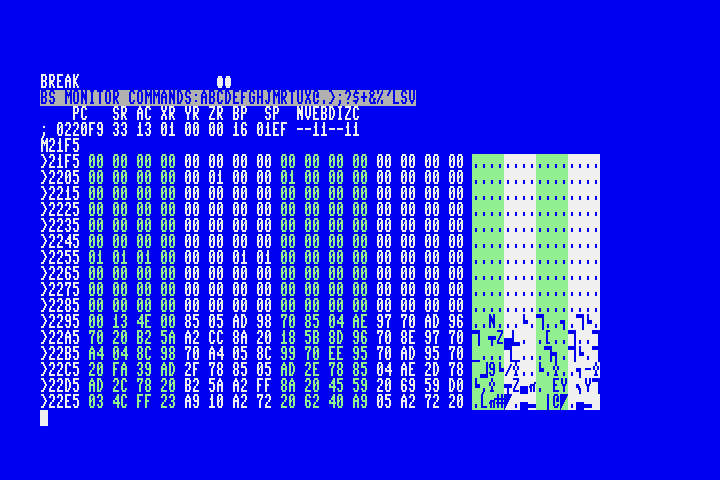
We can see that the blinker on line 4 has been loaded into the line buffer starting at address $2255, with the bottom of the boat just to the left. The previous row has the middle of the boat starting at $220A. We can also see bufsel at address $2295 is 00, which says that for the next row the top half of the line buffer will be considered the “current” row. (Our program is about to write line 5 to this part of the buffer, using the other half of the buffer to count the northerly neighbors previously on line 4.)
Looking at the output of M, what are the values of row_ct and col_ct at this point in execution?
Examining memory containing machine code
The M command displays the contents of memory as hexadecimal byte values. It also tries to interpret these values as if they are PETSCII characters. Memory values only sometimes represent PETSCII characters, so this usually looks like a bunch of junk. But when it is PETSCII, it is useful to see it interpreted this way. We could read BASIC strings directly out of memory when we examined addresses starting at $2001.
When the bytes are 45GS02 machine code, it would be nice to see it represented in assembly language. The monitor knows how to do this. Known as disassembly, we can tell the monitor to treat memory as machine code and attempt to backform the assembly language representation. This is the D command.
According to our symbol table, start is at $20d4, the first address of machine code in the GoL program. To start disassembly here:
D 20D4
We can immediately recognize the first few assembly code instructions of our program!
. 20D4  A9 41    LDA  #$41
. 20D6  85 00    STA  $00
. 20D8  A9 16    LDA  #$16
. 20DA  5B       TAB
The disassembly illustrates how our assembly language was translated into machine code. For example, the immediate mode version of lda is represented as the byte A9, followed by the immediate value we provided, 41 (hexadecimal).
You can confirm that $a9 is the correct value by referring to this 6502 opcode chart. In assembly language parlance, the $a9 is the opcode and the $41 is the operand. lda is a mnemonic, something human-readable that the assembler can use to figure out the correct opcode. Notice that a mnemonic may refer to any of several opcodes depending on the addressing mode, which is distinguished in assembly language by the syntax of the rest of the line. lda #$41 is LDA immediate mode ($a9) because of the #. lda $4400 is LDA absolute addressing mode ($ad) because it lacks a # and has a 16-bit address for the opcode.
The next instruction doesn’t look like our assembly language program exactly:
. 20DB 20 9B 21 JSR $2192
We wrote this line as jsr clrbuf. The monitor’s disassembler doesn’t know anything about our labels, so it can only show the raw values that were calculated by the assembler. Sure enough, our symbol list shows clrbuf is $2192.
Notice that the 16-bit address is encoded as least-significant byte first: 92 21. This is conventional for the 6502 line of processors.
The disassembler does not know which memory addresses contain machine code and which memory addresses contain something else. If you attempt to disassemble an address that contains something other than machine code, it’ll display the instructions those bytes represent, even if they are nonsense. Try D 2001 to see how our BASIC bytes would look through machine code-tinted glasses.
You must provide the disassembler a starting address that is the beginning of an instruction. If you give it an address that is in the middle of an instruction, it has no way of knowing that, so it starts disassembly on that byte and misinterprets the subsequent values. Try D 20D6 to see what happens when disassembly starts at the 41 operand byte.
Editing machine code
The monitor includes a rudimentary assembler, so you can edit memory by typing in assembly language instructions. As with the disassembler, the built-in assembler knows nothing about labels, so it is mostly useful for small experiments and temporary changes.
The start assembly, use the A command, a starting address, and the first instruction.
A 3000 INC $D020
The assembler converts the instruction into bytes, writes them to memory, and displays the byte values. It then prompts for the next instruction at the appropriate next memory location.
A 3000  EE 20 D0 INC  $D020
A 3003
You can continue typing instructions to fill memory. Try adding an brk instruction:
A 3003  00       BRK
A 3004
Press Return on an empty line to end the assembly process. You can confirm that the machine code is in memory with D 3000.
Similar to how M outputs lines starting with > so you can set values by editing the output, D outputs lines starting with ., an alias for A. It knows to ignore the hex values from the previous interpretation, so you can simply cursor over to the instruction, edit it, and press Return.
If you change an existing instruction in a way that changes the number of bytes in the machine code for that instruction, subsequent instructions will be mangled or in the wrong place. The monitor tries to help by offering to continue to assemble subsequent lines on the screen while it updates addresses, though it can only go so far as D’s output on the screen. Press Return on each line you want re-assembled.
Executing machine code
The G command flees the monitor and starts executing machine code at a location in memory. The routine we assembled at $3000 changes the border color then breaks back into the monitor:
A 3000 INC $D020
       BRK
G 3000
G performs a jmp instruction, leaving the monitor for the new address with no intention of returning. In our example, we used brk to end the routine, which sent the machine back to the monitor via the IRQ interrupt.
To perform a jsr (jump to subroutine) instruction, use the J command. Like any jsr, this pushes an appropriate return address to the stack, so the subroutine’s rts will return to the monitor. (We cannot use G to call a subroutine because jmp does not push a return address to the stack.)
A 3000 INC $D020
       RTS
J 3000
Let’s try using J to test the GoL program’s swapbuf subroutine. Remove the “row 5” test lines we added earlier, and re-assemble, again regenerating the symbol list. Load the GoL program into memory (do not run the program), then enter the MONITOR command at the READY. prompt.
Check the updated symbol table for the address to swapbuf; it should be $218a. Also get the address for bufsel, the memory that swapbuf modifies; I have it as $228c.
Confirm that bufsel starts as 0:
M 228C
>228C 00 ...
Now jsr to swapbuf:
J 2189
Did it work? Let’s check bufsel:
M 228C
>228C 01 ...
As expected, bufsel is now 1. We can J 2189 again then M 228C again to watch it go back to 0.
The setcurbuf routine sets a value in the current line buffer at the column indicatd by the Y register to the value in the A register. To test this subroutine, we can use R and ; to update the Y and A registers, then J to call the routine.
R
    PC   SR AC XR YR ZR BP  SP  NVEBDIZC
; 00218A 32 00 00 00 00 00 01FB --11--1-

; 00218A 32 01 00 05 00 00 01FB --11--1-

J 21A0
M 21EC
In the previous article, we tested the countbufneighbors routine by adding a bunch of test code to the program itself to write test values to the line buffers, call the routine, then brk out to the monitor to examine the result stored in the accumulator. How would you perform the same test of countbufneighbors using only monitor commands, without adding any code to the program?
Resuming the program
As we’ve discussed, the brk instruction stashes everything about the state of the CPU registers before invoking the monitor, in part so the monitor can report it. When you use the G command, the monitor restores this state just before jumping to the new address. This allows you to resume your program where it left off after the brk instruction. The address of the next instruction is conveniently stored in the program counter.
To resume execution from the program counter, use G without arguments:
G
ROM versions prior to 920377 had a bug where the monitor had the wrong upper byte in the program counter, causing G without arguments to fail to resume the program. This bug is fixed in ROM 920377.
If you’re using an earlier ROM, as a workaround, use the R command to inspect the program counter, ignore the first two digits, and use G with the last four digits. The GoL program lives entirely in page 00.
Earlier we added logic to the GoL program to brk at the beginning of row 5, when row_ct was equal to 19. If you removed that logic, add it back in, run the program as before (you can skip entering the pattern), and let it break to the monitor. My registers look like this:
    PC   SR AC XR YR ZR BP  SP  NVEBDIZC
; 0020F9 33 13 01 00 00 16 01EF --11--11
row_ct and col_ct are at $228d and $228e. Checking their values:
M 228D
>228D 13 4E ...
Resume the program like so:
G
Did it work? It looks like we’re immediately back in the monitor. The program should have proceeded with another iteration of the column loop, stopping at the next column because row_ct is still 19 ($13). Let’s check our variables again:
M 228D
>228D 13 4D ...
Sure enough, col_ct has gone down by one. We can repeat this procedure to confirm that it is processing the columns—though of course because our program was storing the board directly in screen memory, we’ve clobbered the game board! Maybe next time we can store the board somewhere else. 😅
Accessing I/O and ROM locations
By default, using the memory locations $d000-$dfff, $6000-$7fff, or $e000-$ffff from the MEGA65 monitor accesses the RAM at those locations. These are also the locations of I/O registers ($d000-$dfff) and interesting ROM locations: $6000-$7fff is the monitor’s own code, and $e000-$ffff is the MEGA65 kernel. If you want the monitor to access the I/O registers and ROM, prefix the address with 8000, such as 8000D000. This sets bit 31, which is a signal to the monitor that you want the ROM and not the RAM for these addresses.
To display the current I/O register settings:
M8000D000
To change the border color to yellow:
>8000D020 07
The “ROM” locations are write-protected. Attempting to edit them has no effect. There’s a way to disable this write protection, but we’ll skip this for now. (Ask in the Discord if you need to know. 😄)
Take care when using the > command to change values of the I/O registers. Updating some registers changes the machine’s behavior even when you set the register to its current value. If you cursor up to a line of the output from M8000D000, change a value, and press Return, this updates every register on the line with the value on the screen, even the values you did not change. This may have unintended side effects!
More monitor commands
The monitor is generally useful for manipulating memory in various ways.
To fill a region of memory with a value: F <start> <end+1> <value> The end address is one past the last address to be set.
F 3000 3100 BB
M 3000
To compare two regions of memory: C <start-a> <end+1> <start-b> This reports the addresses in the first region that differ from the addresses in the second region.
>3080 BB CC BB CC BB BB CC
C 3000 3080 3080
To find (“hunt”) every occurrence of a byte sequence in a region: H <start> <end+1> <value> [<value...>] This reports the starting address of each matching sequence found.
H 3000 3100 CC BB
To copy (“transfer”) a region of memory to another location: T <start> <end+1> <start-b>
T 3080 3100 3000
M 3000
C 3000 3080 3080
To save a region of memory to disk as a PRG file: S "filename",8 <start> <end+1> where 8 is the unit number of the disk. (As far as I can tell, the unit number is required, and does not default to 8 like BASIC does.) The PRG file stores the original memory address, so a BASIC command line DLOAD will write it back where it was.
S "SOMEDATA",8 3000 3100
To save while overwriting an existing file, prefix the filename with @0::
S "@0:SOMEDATA",8 3000 3100
To load a region of memory from a PRG file on disk to its original location: L "filename",8 To load the file to a new location: L "filename",8 <start>
L "SOMEDATA",8 3100
M 3100
C 3000 3100 3100
There’s a verify command, V "filename",8 <start>, but I can’t figure out how it’s supposed to report its results. It prints some characters at the top of the screen, but it doesn’t seem to change behavior if the memory does or doesn’t match the file. A workaround is to load into a different region of memory, then use C to compare the intended region with the other region.
The @ command can perform various disk operations:
@: displays the drive status@$: displays the disk directory@followed by a DOS command : execute the DOS command- The
@can be followed by a unit number, in all cases. The default unit is 8.
@$
@0 "DISK NAME             " 20 1D
2    "SOMEDATA"               PRG

@
00,OK,00,00

@R0:MOREDATA=SOMEDATA
00,OK,00,00

@$
@0 "DISK NAME             " 20 1D
2    "MOREDATA"               PRG

@9
00,OK,00,00

@9$
@90 "OTHER DISK           " 20 1D
55   "COOL GAME"              PRG
The Freeze monitor
For completeness, let’s discuss another monitor built into the MEGA65, the Freeze monitor. This is accessible from the Freeze menu. Hold Restore for a couple of seconds, then release. This freezes the state of the currently running program. Unlike an interrupt, this captures the complete state of the CPU and all memory, and you can use the Freeze application to save, load, and manipulate these states. (This is very useful for pausing games!)
From the Freeze menu, press M to start the Freeze monitor. This looks similar to the MEGA65 monitor, but instead of examining the live memory of the machine, it examines the memory of the current freeze state.
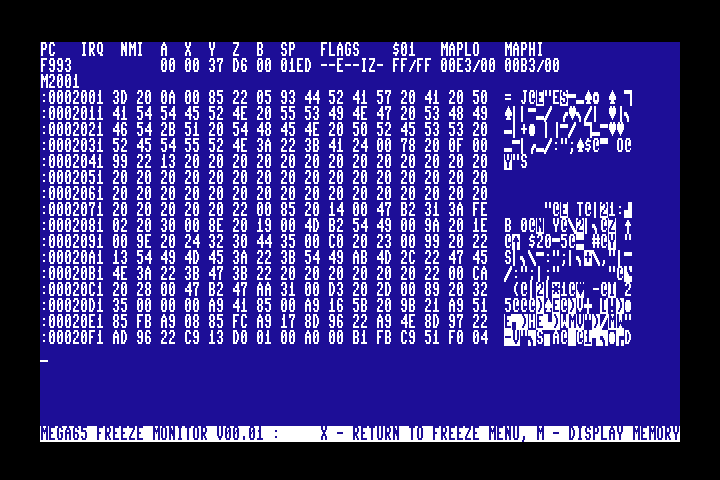
The Freeze monitor only has four commands: M (display memory), R (display registers), S (set memory values), and X (exit). It is apparent from the source code that this monitor was planned to be more complete: it accepts but ignores D, A, F, and H, with room in the code for future expansion. Also the PETSCII sidebar of the memory viewer doesn’t seem to work.
One advantage that the Freeze monitor has over the MEGA65 monitor is it can cleanly restart the frozen state after memory has been modified. You can save multiple copies of a frozen state, modify them in different ways for testing, and come back to them later.
It’s not clear whether someone will finish the Freeze monitor, or whether it’s worth having a separate Freeze monitor now that the MEGA65 monitor and Matrix Mode monitors are so powerful. Maybe one of the other monitors could be made to work with the Freeze application for the best of both worlds.
Next steps
The MEGA65 monitor gives us ways to visualize the state of the CPU and memory during execution of our assembly language program without adding visualization code to the program itself. It also gives us an experimentation platform for inspecting, tweaking, and manipulating memory and code directly on the MEGA65. Whether invoked by a simple brk instruction or by the MONITOR command, the monitor is a powerful tool that makes the invisible visible.
It’s still kind of a pain to add brk instructions to our code, though. Could this be even easier? It can, thanks to a powerful feature of the MEGA65 that is essentially impossible on vintage computers. We will look at the Matrix Mode debugger in the next article.