Using MEGA65's Matrix Mode
The MEGA65 has a powerful debugging facility built into it that would have been high fantasy for vintage computer programmers back in the day: the Matrix Mode debugger. Today in Lab Notes, we explore Matrix Mode’s capabilities to further help us with assembly language programming, continuing to use our Game of Life program as an example.
Articles in this series:
- Game of Life on the MEGA65, in BASIC
- Game of Life on the MEGA65, in assembly language
- Using the MEGA65 Monitor to troubleshoot assembly programs
- Using MEGA65’s Matrix Mode
The story so far
We prototyped a MEGA65 version of Conway’s Game of Life in BASIC. We reimplemented the generation algorithm in assembly language for a huge speed increase, and discussed assembly debugging techniques that involved adding test code and data visualizations to the program itself. We did a deep dive on the MEGA65 machine language monitor, which allowed us to do some of the same debugging tasks by adding only brk statements (and occasionally some conditional checks) to the code.
Today, we will explore another powerful tool for debugging machine code, something exclusive to the MEGA65 that I could barely dream about with vintage computers back in the day: the Matrix Mode debugger.
We’ll continue to use our Game of Life program as an interactive example. As before, make sure you have the ACME assembler and the Game of Life source file:
Use this command to build the PRG file and generate the symbol list:
acme --symbollist golml.lst golml.a
Today, we’ll be debugging without making changes to the program code. If you don’t have a a JTAG or serial connection, you can just copy the PRG file to your MEGA65’s SD card, and load it as needed like so:
DLOAD "GOLML.PRG",U12
That said, if you don’t have a JTAG or serial connection, you’ll want one by the end of this article.
What is the Matrix Mode debugger?
Most of the MEGA65 architecture roughly resembles the Commodore 65 on which it is based: there’s a CPU, memory, video and sound hardware, and interfaces for the vintage peripheral ports. This architecture runs our BASIC and assembly language programs, as well as code in the ROM for the kernel, the BASIC interpreter, and the MEGA65 monitor. This CPU can either run our program or it can run the MEGA65 monitor. As we’ve seen, we can add a brk instruction to interrupt our program and start the monitor.
Surrounding the C65-like hardware is an outer shell with its own operating system (known as the Hypervisor). This manages all of the modern conveniences and hardware interfaces, such as the configuration utility, the SD card, the core manager, and the Freeze utility.
The Matrix Mode debugger is a tool in the outer shell. It has greater visibility into—and control of—system state than the MEGA65 monitor because it runs outside of and simultaneous to the C65-like inner architecture. Like the MEGA65 monitor, it has features for inspecting and editing memory and register contents. It can also do things the MEGA65 monitor could ever do: it can pause the CPU entirely, tell it to step through machine code one instruction at a time, and watch a running program for specific changes to the program counter, registers, and memory locations.
The debugger uses a simple command interface. This interface can be accessed directly on the MEGA65, or it can be accessed from your PC over a serial connection with a JTAG/serial adapter. The command interface also serves as a serial protocol that cross-development tools can use to manipulate the MEGA65.
Let’s start by taking a look at the command console options. Then we will explore how to use Matrix Mode commands to perform debugging tasks.
The Matrix Mode command console
Try this: Load and run Game of Life. Draw a quick pattern, something that cycles (such as the blinker), then press Return to start the evolution.
While the program is running, hold the Mega key, then press Tab.
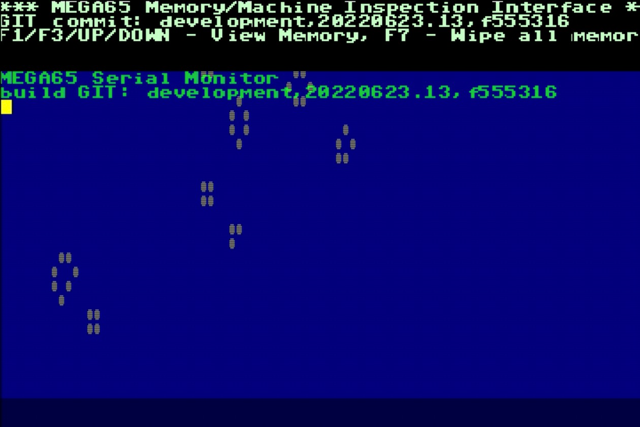
Welcome to Matrix Mode! Named and styled after the 1999 sci-fi action thriller, Matrix Mode lets you perform machine language monitor tasks while the program is running. You can see Game of Life spinning away behind the Matrix Mode display.
Type h then press Return. The Matrix Mode console prints Serial Monitor and the version ID of the MEGA65 core that is currently running.
To exit the Matrix Mode console, hold the Mega key then press Tab again.
A note on terminology: MEGA65 documentation refers to the entire debugger feature as “Matrix Mode” or “the monitor.” I’m calling it “the Matrix Mode debugger” or “the debugger” to distinguish it from the Matrix Mode console that you open with Mega+Tab, and from the MEGA65 monitor we’ve used previously. As we’re about to see, there are other ways to access the debugger besides the Matrix Mode console.
Using a serial console on your PC
The Matrix Mode console is an on-device command console that sends commands to and prints results from the debugger. This same command interface can be accessed from your PC over a JTAG or serial connection.
The M65Connect app has a built-in console capable of sending commands to the debugger and displaying responses over such a connection. If you don’t already have this installed, download it from Filehost: there are versions for Windows, Mac, and Linux. See The MEGA65 Welcome Guide for more set-up instructions.
The M65Connect window has a series of function buttons along the top, a Console window, and an area for typing commands. When connected to your MEGA65, the Console and command area give you complete access to the same debugger command interface as the Matrix Mode console.
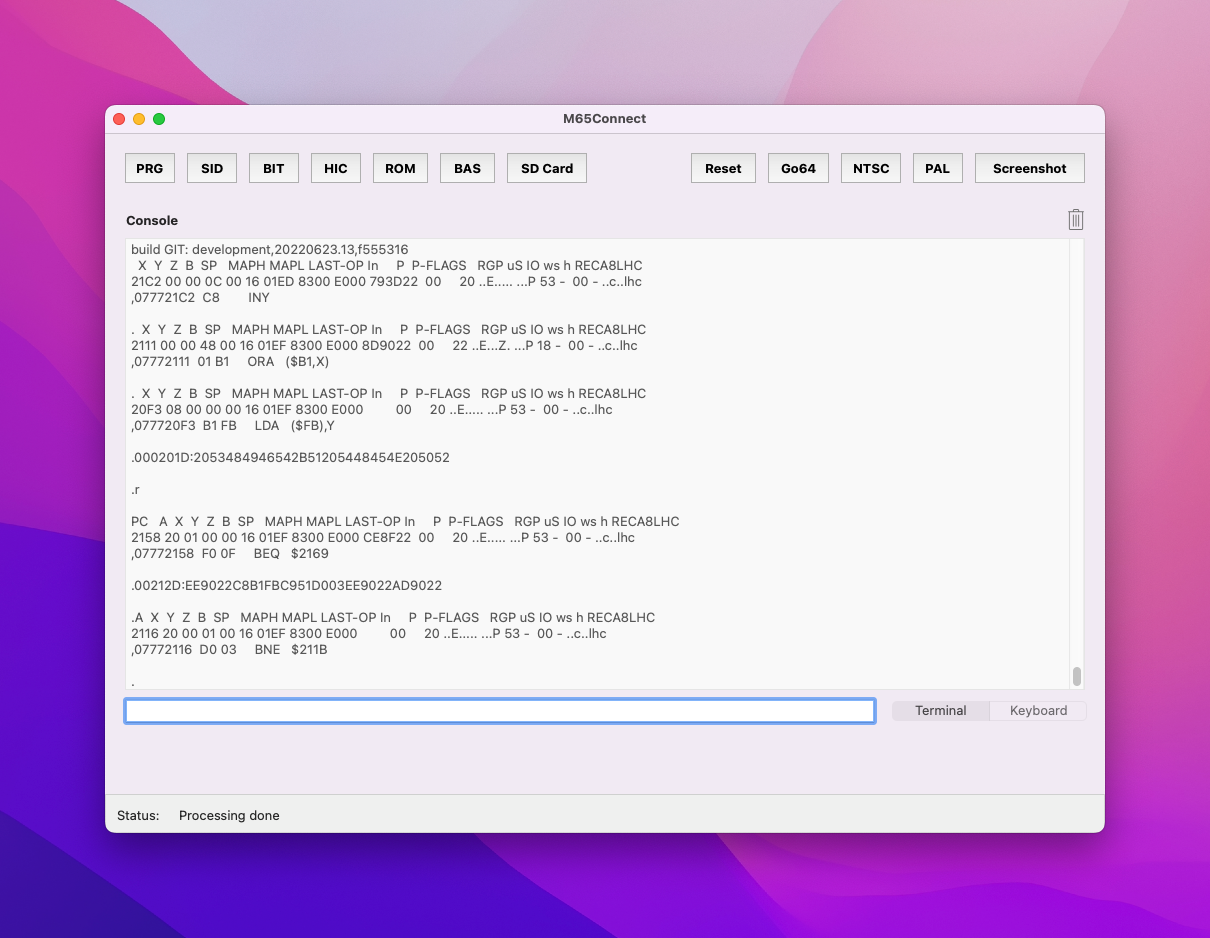
Don’t like the default fonts and colors of the M65Connect console? Go to the Settings menu, select Console, and pick new ones!
As another option, you can use any serial console app to connect to the debugger. For Windows, programs like PuTTY or HyperTerminal work well. For Mac, I like Serial, a robust app with excellent features. Serial costs $39.99 US, but it earns its price for ease of use.
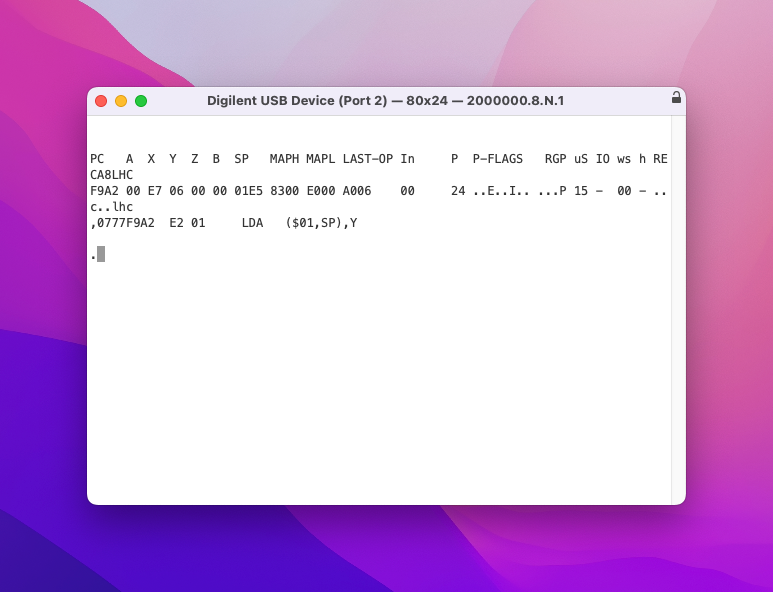
If you like a terminal window and don’t want to pay money, picocom fits the bill nicely. It’s available for Windows via Cygwin, for Mac via Homebrew (brew install picocom), and for Linux via any package repository. Or you can just download and build it from Github.
The MEGA65 serial connection uses the unusual bitrate (“baud”) of 2000000. Other settings are common: 8 databits, 1 stop bit, no parity bit. Configure your serial console app accordingly. For picocom, use this command line to start, substituting your serial port or device for the final argument:
picocom --baud 2000000 --databits 8 --stopbits 1 --parity n /dev/cu.usbserial-9
To exit picocom, type Ctrl+A then Ctrl+X.
Make sure Matrix Mode is closed on the MEGA65, then open M65Connect or a serial console app and connect to the appropriate device. Type the h command and press Return. (In M65Connect, use the text field below the console output to enter a command.) If everything is working, the core version message appears, just as it did in the Matrix Mode console.
The serial connection can only accept commands while the Matrix Mode console is closed. If the Matrix Mode console is open on the MEGA65, the serial console will not receive keystrokes, and serial features of M65Connect or the m65 command will not work. Be sure that Matrix Mode is closed before using these features.
A serial console will receive data from the MEGA65 with the Matrix Mode console open. When you enter commands in the Matrix Mode console, the output appears on the screen and is sent over the serial connection. This is handy for recording command output while using the Matrix Mode console.
Determining the serial port or device
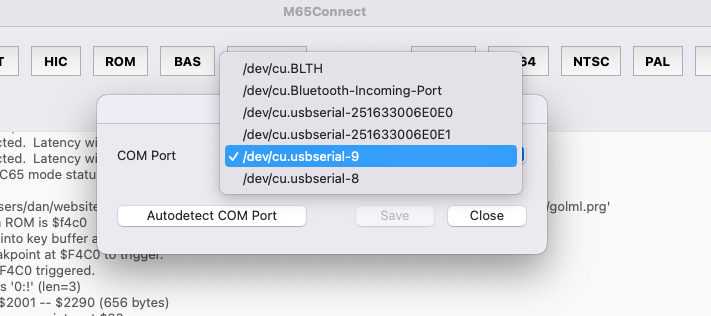
Any serial console app needs to know the serial port or device for the JTAG adapter, similar to the M65Connect app and m65 command. This is a COM port on Windows, or a USB serial device path on Mac or Linux. Your computer may have more than one “serial port” or “USB serial device” recognized by the operating system—even if the only actual USB serial device you have connected is the JTAG adapter.
M65Connect’s Connection settings window (Settings menu, Connection) lists the available serial ports/devices in a dropdown menu, and can attempt to auto-detect which one is the correct one to use. In my experience on a Mac, my JTAG adapter shows up as four different devices, only one of them is the correct one, and M65Connect’s auto-detect doesn’t work. I usually have to try each option until I find the right one. The answer is usually one that looks like /dev/cu.usbserial-9. Moreover, it changes between sessions! The device path stays the same until I reboot my Mac or unplug the JTAG device.
I usually use M65Connect’s Connection interface to figure out the correct serial device at the beginning of the session, even if I intend to use another tool like the m65 command or a serial console app. A future version of m65 will have improved Mac-compatible port detect logic, and hopefully that will be added to M65Connect as well.
Which console is best?
The various methods of accessing the debugger have advantages and disadvantages.
The Matrix Mode console is on the MEGA65 itself and can be used without a PC or serial connection. Other than the flashy opening animation, it’s not much to look at, and the 40-column display wraps lines in a way that’s sometimes difficult to read. It uses color when displaying memory, which is not available in a serial console. It covers the MEGA65 display translucently, which is a cute trick but can still get in the way depending on what you’re debugging. Debugging sometimes involves analyzing a bunch of data, and viewing all of the console output on the MEGA65 means I can’t copy that data to a file.
The Matrix Mode console currently has a bug in the NTSC video mode. Once you fill the screen with commands, the prompt will be one line below the bottom of the screen and you’ll have to type commands blindly from then on. PAL mode does not have this issue, though my display doesn’t handle PAL mode very well. For me, this means Matrix Mode is only good for occasional use, and anything else needs a serial connection.
M65Connect is convenient but also has issues. I like how a single app can beam newly built PRG files, take scerenshots, and interact with the debugger all in one interface. Only one PC app can access the serial port at a time, so it’s useful for my serial console to also be a multi-tool. The current release of M65Connect has an issue where it won’t let you send an empty command to the debugger, which is useful in some cases (though there are workarounds); this will be fixed in a future release.
A serial console app provides a complete, copy-pasteable display of every character sent to and received from the debugger. It also hogs the serial connection, so you can’t use M65Connect or m65 to beam PRG files while it is open. Personally, I find it convenient enough to close the serial app every time I want to use another tool; it reopens instantly. If there’s session history in the serial app that I want to keep, I copy and paste it from the serial app to a text file.
Inspecting memory
The debugger can perform commands similar to the MEGA65 monitor. It isn’t as friendly to use as the MEGA65 monitor, and it has a somewhat different feature set.
Our GoL program is still running, so let’s take a peek at the GoL line buffer. Enter this command in your console of choice:
m 21ec
The reply looks something like this:
00021EC:00000000000000000000000000000000
The m command displays values from memory, similar to the MEGA65 monitor. As you can see, it only shows 16 bytes, and doesn’t bother with a PETSCII interpretation (because you may not even be on a PETSCII-capable serial console). It also runs all the hexadecimal digits together, which is kind of difficult to read in a serial console. Matrix Mode adds a bit of color, which helps some.
You can type m without an address to view the next 16 bytes.
m
You can also use M (Shift+M) to request that it display 256 bytes at a time. (Unlike the MEGA65 monitor, debugger commands can be lowercase or uppercase.) Without an argument, it will display the next page of 256 bytes.
M 21ec

M
When you use a 16-bit address (four hexadecimal digits) with the debugger, it always assumes you mean the address in the first 64 KB of RAM, as if preceded by 000. The debugger accepts 28-bit addresses (seven hexadecimal digits) to access the entire MEGA65 memory space, like so:
M 00021ec

M 8000000
If you want to use a 16-bit address interpreted in the context of the CPU’s current memory map settings, use the special address prefix 777 followed by the four hexadecimal digits:
M 77721ec
Remember that the GoL program is actively running while we do this! It is processing the entire screen 100 times a second, which means it is updating the line buffer 2,300 times a second. We peeked at the line buffer at some arbitrary point in time, which is not particularly useful, especially if we’re sampling 16 bytes at a time. The entire buffer could have been rewritten thousands of times between commands.
The Matrix Mode console has keyboard shortcuts to browse memory quickly. After issuing an m or M command, use the F1 and F3 (or Cursor up and Cursor down) to browse the next region of memory with increasing or decreasing addresses, respectively. These keyboard shortcuts are only available through Matrix Mode, though the results are also sent over the serial connection.
Inspecting memory as machine code
Similar to the MEGA65 monitor, the debugger can do rudimentary disassembly, displaying memory interpreted as assembly language instructions. Small d followed by an address disassembles one instruction. Capitol D followed by an address disassembles 16 instructions.
d 20d4

D 20d4
As with viewing memory, you can enter d or D without an address to continue disassembly from where it left off.
Inspecting registers
Let’s try peeking at the registers. Enter the r command—or just press Return/Enter at the prompt:
r
I get this response:
.PC  A  X  Y  Z  B  SP   MAPH MAPL LAST-OP In     P  P-FLAGS   RGP uS IO ws h RECA8LHC
2129 20 01 50 00 16 01EF 8300 E000 B1FB    00     20 ..E..... ...P 4A -  00 - ..c..lhc
,07772129  C9 51     CMP   #$51
We can recognize the program counter PC, the registers A X Y Z and B, and the stack pointer SP. Our friends the status flags are labeled here as P (the flags as an 8-bit number) and P-FLAGS (a visual rendering); if set, their letter appears (NVEBDIZC). That third line is the disassembly of the instruction at the program counter.
MAPH and MAPL are the Hypervisor MAP register, a 32-bit value. This powers the memory mapping mechanism of the 45GS02 that allows up to 1 megabyte of address space to be accessible with a 16-bit address bus. I hope to cover MEGA65 memory management in its own article, but suffice it to say that this is a powerful feature, and once you get into it it’s crazy important to be able to peek at this value.
RECA8LHC at the end are ROM banking flags, as controlled by the bits at $D030. This becomes useful to see when you start diving into memory banking. See “CPU Memory Banking” in appendix F of the book and related references for more information. I don’t actually know if all eight bits of $D030 appear here, but this is how they are defined according to the manual:
R: ROM page E (ROME):$3E000-$3FFFF→$E000E: Character set ROM (CROM9):$29000-$29FFF→$D000(“Select between C64 and C65 charset”?)C: ROM page C (ROMC):$2C000-$2CFFF→$C000A: ROM page A (ROMA):$3A000-$3BFFF→$A0008: ROM page 8 (ROM8):$38000-$39FFF→$8000L: Use palette ROM (0) or RAM (1) for colors 0-15 (PAL)H: Enable external video sync (genlock), not really a thing and unrelated to ROM banking (EXTSYNC)C: Color RAM (CRAM2K): map 2nd KB of color RAM to$DC00(full range$D800-$DFFF)
The rest are only interesting if you’re hacking on the MEGA65 Hypervisor code or the FPGA. As best as I can figure out from the assembly code for the Matrix Mode monitor, the VHDL for the 45GS02 processor, and some light experimentation, the remaining values are:
LAST-OP: The hexadecimal machine code of the last instruction executed. Note that this is the machine code itself as bytes, not the address of the instruction.In: “Instruction.” I’m only seeing this show up as00, so I don’t know what it is.RGP: Mysterious flags! ActuallyMRGP. I don’t know why the M isn’t in the legend (but there’s space for it).uS: The internal processor state. Mostly useful for FPGA troubleshooting. Seeprocessor_statein gs4510.vhdl if you’re curious.IO: “I/O fast mode,”Wfor write,Rfor read,-for none.ws: “Wait states,” a byte value, only useful for FPGA troubleshooting.h: Hypervisor mode:Hif the CPU is running in Hypervisor mode, or-if running in user mode. You can see this set toHif you use a serial console while in the Configuration menu, for example.
I’m pestering the MEGA65 team to help provide better explanations. If I learn more I’ll update this article. But that’s more than enough for everyday assembly language programming.
Executing code one step at a time
Computers are just too fast for peeking at the system state while the system is running. We need to slow things down if we’re going to learn anything useful.
With GoL running, enter these commands in the debugger:
t1
i1
r
When you entered t1, the GoL program froze in its tracks. If you’re using Matrix Mode, you should be able to see this through the translucent display. If you’re using a serial console, the frozen display is in full view.
The t1 command initiates trace mode. In this mode, the MEGA65 main CPU does not execute instructions until we tell it to through the debugger. We can examine every instruction as it gets executed, including how it changes memory and registers.
Press Enter (serial console) or Return (Matrix Mode) to advance by one instruction. (In M65Connect, you have to type t as a command (no arguments) to advance.) The instruction is executed, and registers are re-displayed. Notice the change in the program counter (PC) and any anticipated effects in the other registers. To execute a bunch of instructions to fast forward to an interesting part, you can hold the Enter key down while keeping an eye on the program counter.
The i1 command disables interrupts. You can see this in the debugger’s register output, under P-FLAGS: previously, the I flag was set (interrupts were enabled), now it is unset (interrupts are disabled). It is useful to disable interrupts before entering trace mode so you’re not spending your time stepping through system interrupt handlers when you want to be stepping through your (non-interrupt) code.
Re-enable interrupts, then disable trace mode to return to full speed execution:
i0
t0
When you’re in the Matrix Mode console, you won’t be able to exit the console while in trace mode. Disable trace mode, then exit the console with Mega+Tab. If you want to see the full screen while in trace mode, use a serial console to access the debugger.
There’s a third possible state for trace mode that you can activate with the command tc. This causes the CPU to run continuously while also dumping register output with every instruction. This is so much data that it’s not useful from a console. It is better used with testing tools that connect via serial, issue the command, and harvest the data for analysis or real-time display.
Impressively, it seems to do this without slowing down the machine. GoL runs at 100 fps with tc mode enabled.
Stopping somewhere specific
With our GoL program, chances are pretty good that when you typed t1 the CPU stopped somewhere outside of the GoL code ($20d4-$2290), maybe at an address that began with E or F. This is because our GoL program uses a main loop written in BASIC. The CPU spends a lot of time in the BASIC interpreter code, and comparatively less time in our actual machine code algorithm.
You could make a simple change to the GoL program so that execution stays in our machine language code once it is running, at the expense of disabling our timing code. How would you do it? (Hint: replace a single instruction.)
Instead of stopping the CPU wherever it is when we type t1, it’d be much nicer to stop when the program counter has reached a specific address. For example, with our BASIC outer loop, we might want to stop specifically at the start of our machine code, $20d4, so we can step through it without getting lost in the BASIC ROM.
The b command sets a breakpoint at an address. The debugger watches the CPU’s program counter, and when it reaches the given address, it enters trace mode.
With the GoL program running, tell the debugger to enter trace mode at the first instruction of our machine code:
b 20d4
The program should freeze immediately, because it starts this routine 100 times a second. In your console, the debugger prints the registers at the stopping point.
Notice that the program counter is now at $20d6. The debugger allowed the instruction at $20d4 to execute, then took control and entered trace mode. The next instruction (STA $00) is displayed, along with all of the other registers.
You are now free to use all of the monitor commands to inspect memory and registers, and make potential modifications.
Try resuming the program with t0:
t0
The GoL pattern iterates by one step, then the program freezes again because the breakpoint is still set at the top of the routine. To clear the breakpoint, enter the b command without arguments:
b
Now you can exit trace mode with t0, and execution will proceed uninterrupted.
The debugger only supports one breakpoint at a time. The address must be the starting address of an instruction; try to stop on someone’s operand and it’ll blow right past it. You can use your symbol list to find the starting addresses of your labeled subroutines. You can also use the debugger’s disassembler to find the address of a specific unlabeled instruction.
The debugger also knows how to pause the program when a specific memory address has changed. The w command sets up a watch on an address. For example, we can set up a watch on row_ct so it pauses after each row.
w 228d
A watch enters trace mode every time the value at the address is updated, even if it is updated with the same value it already has. It triggers no matter what code made the update—and you can see who made the update by examining the program counter.
When I set a watch on row_ct just now, it stopped with the PC at $2170, which I can see from my symbol list is a few instructions after last_col. I can check which row it stopped on by examining the value at row_ct:
m 228d
As with the breakpoint, there can be only one address watch. You can clear it by giving the w command with no arguments. (Don’t forget to exit trace mode with t0 when you’re ready.)
Take a moment to appreciate that not only can we now pause our Game of Life program without rewriting it to contain brk statements, we can execute monitor commands without overwritng the GoL game board on the screen!
This can be especially important when developing games. You may not even be able to display the MEGA65 monitor on the game screen with redefined character sets or non-text video modes. Even if you could, the things you’re troubleshooting are probably on-screen game elements, and the MEGA65 monitor would spoil the investigation like a puppy at a crime scene. With the debugger, the game can run freely, you can pause it without corrupting the display or any memory, and you can advance and continue at any time.
Jumping to an address
You can change the program counter to cause the CPU to start executing at a different address, with the g command:
g 2185
With the CPU running, this is functionally equivalent to a jmp instruction. If the CPU is in trace mode, this sets the program counter so execution will continue at that address either at the next step or when you leave trace mode.
There is no equivalent to the MEGA65 monitor’s J command. It’s not so easy to test subroutines in the debugger as it is from the MEGA65 monitor.
Setting memory values
To set values in memory, use the s command. It takes a starting address and one or more byte values as hexadecimal values.
s c000 00 01 02
The s command takes a 28-bit absolute address and assumes a 000 prefix if you only give four digits. To set values relative to the CPU memory mapping settings, use S (Shift+S):
S c000 AB CD EF
To fill a region of memory with a value, use the f command. The ending address must be one past the actual last address to fill.
f 21ec 228d 00
The Matrix Mode debugger does not offer an assembler. If you need to change machine code in memory, you’ll have to figure out the byte values yourself, though that’s probably never worth the effort. I’d much rather edit the original assembly code, cross-assemble, and re-upload, at least to add a brk statement (00) and use the MEGA65 monitor instead.
There is no way to set the register values directly with a debugger command.
Unlike the MEGA65 monitor, the debugger only accepts hexadecimal values for addresses and bytes.
The debugger has a cool feature that allows a tool to load binary data directly into memory addresses. The tool can issue the l (“load”) command with a start and end+1 address, then immediately send the appropriate number of bytes as binary over the serial connection.
There is no use for this command at a console, but it’s nice to know about if someday you need to write such a tool. This is how tools like the m65 command send PRG files.
Writing custom tools that use the serial connection
I won’t spend a lot of time on this, but I wanted to briefly demonstrate the utility of the serial interface for writing custom tools. Here is a Python program using PySerial that executes the h command and prints the response.
import serial

DEVICE = '/dev/cu.usbserial-251633006E0EA'

with serial.Serial(DEVICE, 2000000, timeout=1) as ser:
    ser.write(b'h\n')
    while True:
        line = ser.readline()
        if not line:
            break
        line = line.strip()
        print(str(line, encoding='utf-8'))
PySerial includes a function that attempts to list available serial ports and devices. Here is Python code to get device paths for all detected devices, similar to the list that M65Connect has in its Connection settings:
import serial.tools.list_ports

devices = [p.device for p in serial.tools.list_ports.comports()]
You could use this to scan all the ports and issue h commands until one responds, so you don’t have to hard-code or pass in the serial device to the tool. Be sure to set timeout so a failed connection knows to move on.
Wanna see something cool? Download this Python script:
Load Game of Life onto your MEGA65, run this Python script in a terminal window on your PC, then run GoL, draw a pattern, then press Return to start it. This script renders the Game of Life game board in the terminal window! Try to figure out how it works.

PySerial comes with a little serial console program, similar to picocom. For use with the MEGA65 debugger, run it from a terminal window like so:
python3 -m serial.tools.miniterm /dev/cu.usbserial-251633006E0EA 2000000
Next steps
Today we looked at the MEGA65 Matrix Mode debugger, a powerful facility for understanding and manipulating the MEGA65 while it is running without having to insert debugging code into our program. The Matrix Mode console makes this command interface accessible directly on the MEGA65. The same command interface is available on your PC over a JTAG or serial connection, which you can use from the M65Connect app or any serial console program.
… What? You want more? More debugging power? More expressiveness in your MEGA65 development workflow? OK, sure, the Matrix Mode debugger command interface may seem a little spare compared to the MEGA65 monitor. Perhaps a more compelling debugging app could run on the PC, using the Matrix Mode debugger command interface behind the scenes.
Sure enough, there are at least two dead sexy MEGA65 debugging applications for your PC. They connect to your MEGA65 over serial, and can even connect to the Xemu emulator if that’s where you’re doing your development. We’ll explore these tools next time.